Tornado Troubleshooting & Feedback
Tornado Log Files
Section titled “Tornado Log Files ”Log File Locations:
Section titled “Log File Locations: ”-
Windows
./ (Application running directory) -
macOS
/Applications/Tornado.app/Contents/MacOS/ -
Linux
./ (Application running directory)
Log File Names & Content
Section titled “Log File Names & Content ”- Main Log File:
TORNADO.Log.txt- Application level logs
- General operation information
- Error messages
- Process Log File:
TORNADO.Process.Log.txt- Detailed process logs
- stderr outputs
- System level messages
Log Levels
Section titled “Log Levels ”- DEBUG: Detailed debugging information
- INFO: General information messages
- WARNING: Warning messages
- ERROR: Error messages
- FATAL: Critical errors
- PANIC: System crash situations
HTTP Trace
Section titled “HTTP Trace”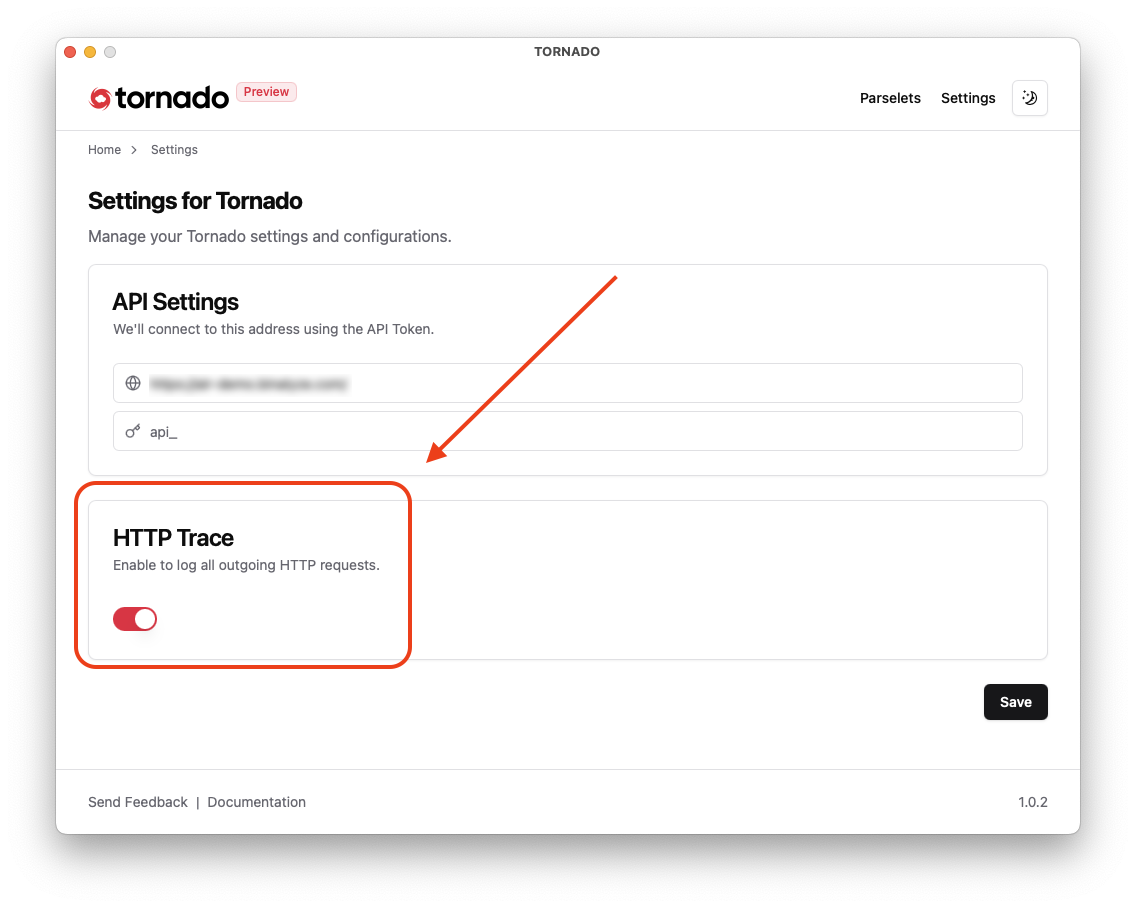
Tornado Troubleshooting & Feedback: HTTP Trace toggled on
Enabling HTTP Trace (Optional)
Section titled “Enabling HTTP Trace (Optional)”What is HTTP Trace?
HTTP Trace is a diagnostic tool that logs detailed data about cloud communication. While not required for basic feedback, it helps diagnose complex technical issues.
When to Enable HTTP Trace
Enable HTTP Trace if you’re experiencing:
- Authentication issues
- Problems with specific collectors
- Unexpected errors
- Performance-related concerns
How to Enable HTTP Trace
- Open the Tornado application.
- Go to Settings from the top menu.
- Locate the HTTP Trace option.
- Toggle the switch to enable it.
Before Enabling HTTP Trace
- Logs will include detailed data on API communication.
- Ensure you have enough disk space.
- Be aware that enabling HTTP Trace may slightly impact performance.
What HTTP Trace Captures
- API request and response details
- Authentication workflows
- Collection progress logs
- Error details and stack traces
- Network communication logs
Submitting Feedback
Section titled “Submitting Feedback”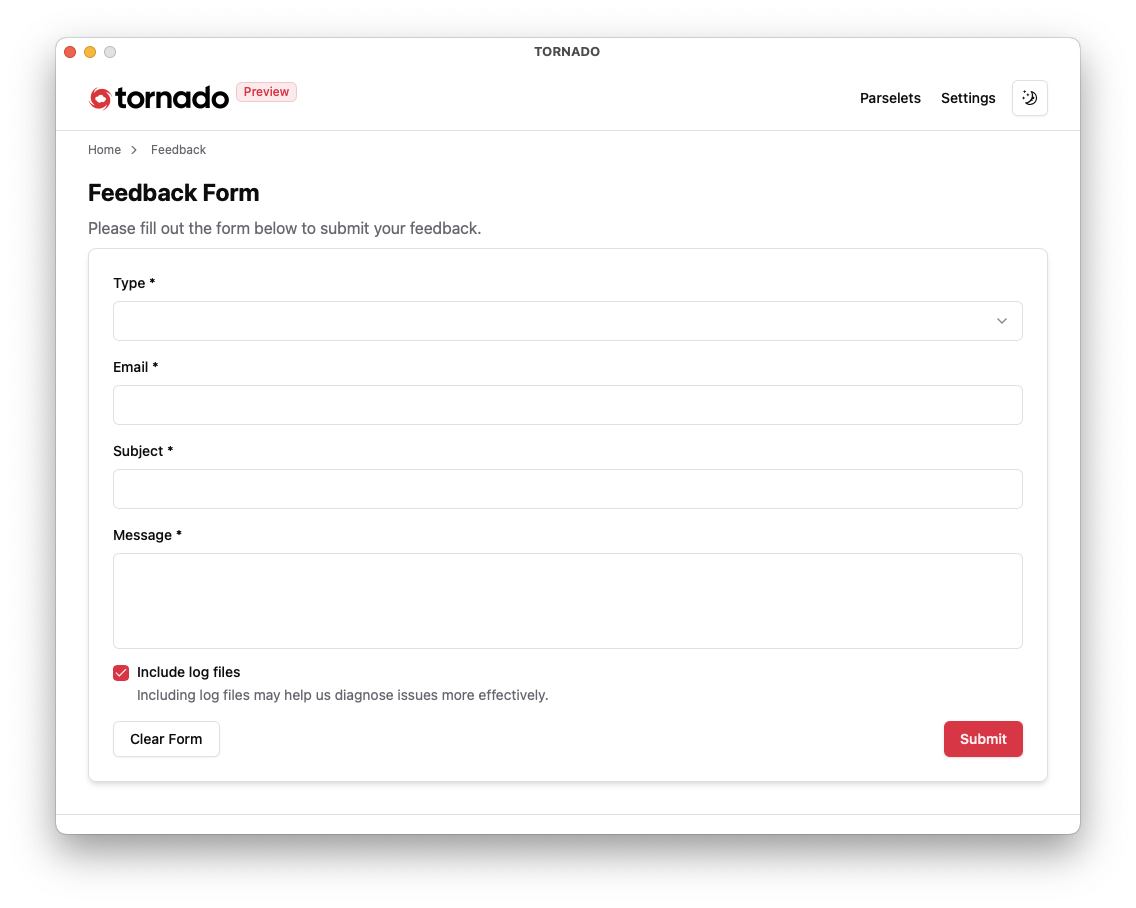
Tornado Troubleshooting & Feedback: The Feedback form
Automatic Log Collection Tornado automatically gathers essential diagnostic data, including:
Section titled “Automatic Log Collection Tornado automatically gathers essential diagnostic data, including:”- Application logs
- Error messages
- Collection statuses
- System configurations
- Task execution details
- Authentication statuses
Steps to Submit Feedback
Section titled “Steps to Submit Feedback”- Enable HTTP Trace (Optional):
- Only if requested by the support team or for complex technical issues.
- Send Feedback:
- Click the Send Feedback button in the application.
- Add comments if necessary (optional).
- Submit:
- Tornado automatically attaches all necessary diagnostic data, so you don’t need to add anything extra.
What’s Included in Logs
Section titled “What’s Included in Logs”- Collection progress and statuses
- Error messages and warnings
- Authentication details
- System configuration data
- Selected collector and setting details
- Task execution logs
After Submission
Section titled “After Submission”- Our team will review your logs and analyze reported issues.
- You’ll receive a response via email with solutions or further instructions if necessary.
Important Notes
Section titled “Important Notes”Privacy & Security
- Logs include only technical details—no personal data is captured.
- All logs and communications are encrypted.
- Logs are automatically cleaned up after use.
Best Practices
- Enable HTTP Trace before reproducing an issue.
- Keep it enabled during the entire troubleshooting session.
- Disable HTTP Trace once the issue is resolved.
- Submit feedback promptly after encountering issues.
For urgent concerns or critical investigations, contact our support team directly through official channels.